如何使用Apache的ab進行壓力測試
《如何使用Apache的ab進行壓力測試》要點:
本文介紹了如何使用Apache的ab進行壓力測試,希望對您有用。如果有疑問,可以聯系我們。
ab是apache自帶的壓力測試工具,當安裝完apache的時候,就可以在bin下面找到ab然后進行apache 負載壓力測試了,測試方法非常的簡單我們只要./ab -n1000 -c100 url就可以了,下面介紹一下具體的使用方法
一、下載
1、可以安裝apache/mysql/php套裝軟件:xampp
2、可以直接上apache官網下載apache
選擇windows版本: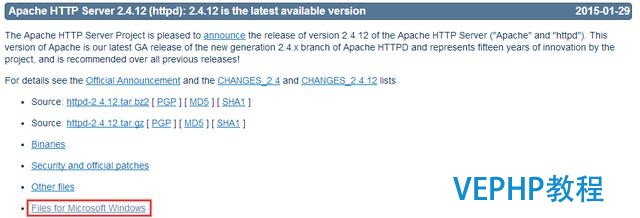
選擇具體類型: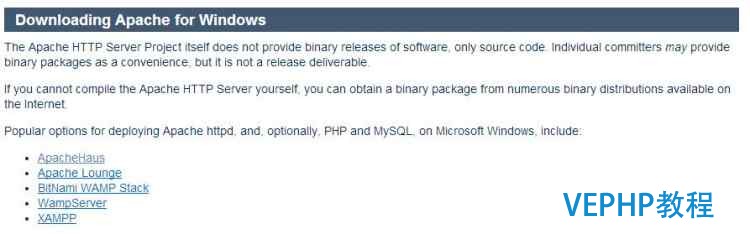
其中后兩個是有名的wamp以及xampp集成環境,如果只想下載apache可以選擇前三個網站,這里我們第一個ApacheHaus為例
下載完后直接解壓到硬盤,我這里解壓到D盤,ab.exe程序就在D:\Apache24\bin中.
二、使用ab.exe
打開cmd,進到bin目錄中,輸入ab回車就可以看到詳細的幫助信息: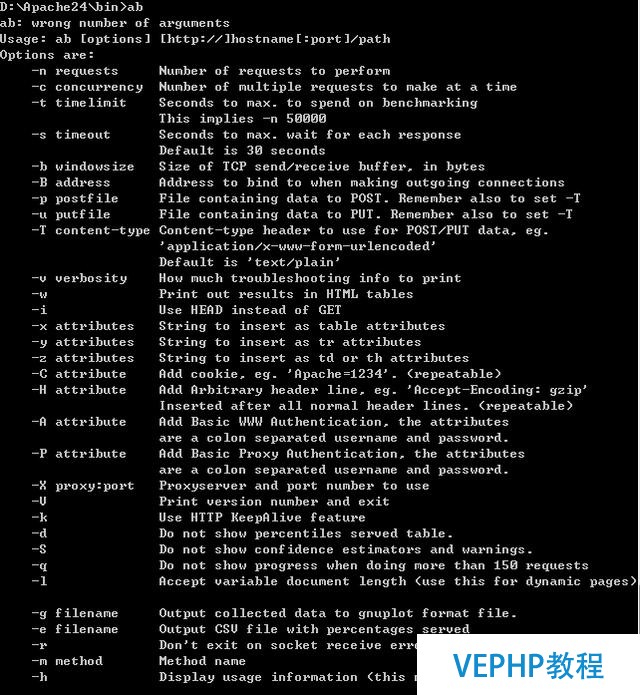
三、測試node.js服務的壓力
我先在linux上啟動一個node程序,此時訪問地址是:http://192.168.132.144:8000/
打開cmd進入到bin目錄中,輸入ab.exe -c 1000 -n 1000 http://192.168.132.144:8000/
注意最后一個/必須要輸入,測試結果如下: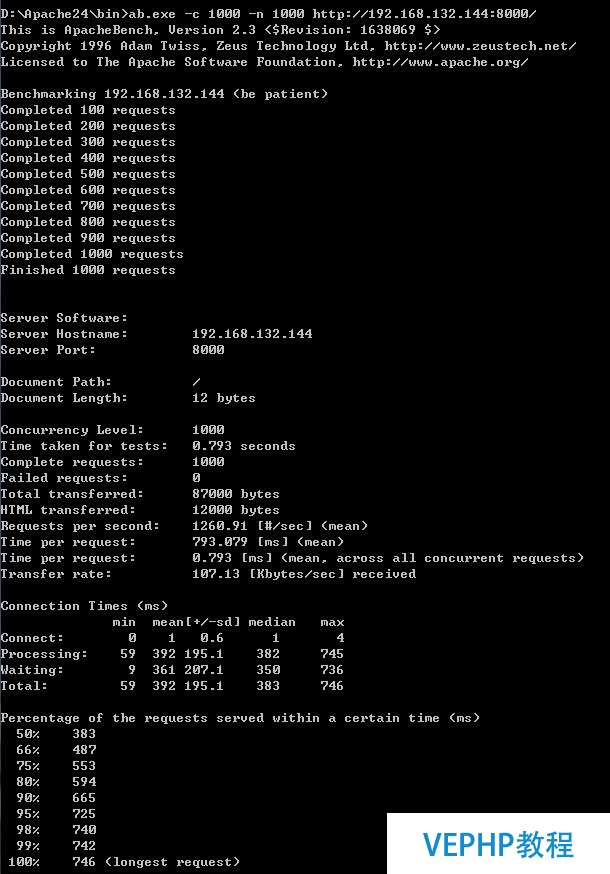
四、Apache的ab命令集合
格式: ./ab [options] [http://]hostname[:port]/path
參數:
-n requests Number of requests to perform
//在測試會話中所執行的哀求個數.默認時,僅執行一個哀求
-c concurrency Number of multiple requests to make
//一次產生的哀求個數.默認是一次一個.
-t timelimit Seconds to max. wait for responses
//測試所進行的最大秒數.其內部隱含值是-n 50000.它可以使對服務器的測試限制在一個固定的總時間以內.默認時,沒有時間限制.
-p postfile File containing data to POST
//包含了需要POST的數據的文件.
-T content-type Content-type header for POSTing
//POST數據所使用的Content-type頭信息.
-v verbosity How much troubleshooting info to print
//設置顯示信息的詳細程度 - 4或更大值會顯示頭信息, 3或更大值可以顯示響應代碼(404, 200等), 2或更大值可以顯示警告和其他信息. -V 顯示版本號并退出.
-w Print out results in HTML tables
//以HTML表的格式輸出結果.默認時,它是白色背景的兩列寬度的一張表.
-i Use HEAD instead of GET
// 執行HEAD哀求,而不是GET.
-x attributes String to insert as table attributes
//
-y attributes String to insert as tr attributes
//
-z attributes String to insert as td or th attributes
//
-C attribute Add cookie, eg. 'Apache=1234. (repeatable)
//-C cookie-name=value 對哀求附加一個Cookie:行. 其典型形式是name=value的一個參數對.此參數可以重復.
-H attribute Add Arbitrary header line, eg. 'Accept-Encoding: gzip'
Inserted after all normal header lines. (repeatable)
-A attribute Add Basic WWW Authentication, the attributes
are a colon separated username and password.
-P attribute Add Basic Proxy Authentication, the attributes
are a colon separated username and password.
//-P proxy-auth-username:password 對一個中轉代理提供BASIC認證信任.用戶名和密碼由一個:隔開,并以base64編碼形式發送.無論服務器是否需要(即, 是否發送了401認證需求代碼),此字符串都會被發送.
-X proxy:port Proxyserver and port number to use
-V Print version number and exit
-k Use HTTP KeepAlive feature
-d Do not show percentiles served table.
-S Do not show confidence estimators and warnings.
-g filename Output collected data to gnuplot format file.
-e filename Output CSV file with percentages served
-h Display usage information (this message)
//-attributes 設置 屬性的字符串. 缺陷程序中有各種靜態聲明的固定長度的緩沖區.另外,對命令行參數、服務器的響應頭和其他外部輸入的解析也很簡單,這可能會有不良后果.它沒有完整地實現HTTP/1.x; 僅接受某些'預想'的響應格式. strstr(3)的頻繁使用可能會帶來性能問題,即, 你可能是在測試ab而不是服務器的性能.
參數很多,一般我們用 -c 和 -n 參數就可以了. 例如:
./ab -c 1000 -n 1000 http://127.0.0.1/index.php
這個表示同時處理1000個哀求并運行1000次index.php文件.
#/usr/local/xiaobai/apache2054/bin/ab -c 1000 -n 1000 http://127.0.0.1/index.html.zh-cn.gb2312
This is ApacheBench, Version 2.0.41-dev <$Revision: 1.121.2.12 $> apache-2.0
Copyright (c) 1996 Adam Twiss, Zeus Technology Ltd, http://www.zeustech.net/
Copyright (c) 1998-2002 The Apache Software Foundation, http://www.apache.org/
Benchmarking 127.0.0.1 (be patient)
Completed 100 requests
Completed 200 requests
Completed 300 requests
Completed 400 requests
Completed 500 requests
Completed 600 requests
Completed 700 requests
Completed 800 requests
Completed 900 requests
Finished 1000 requests
Server Software: Apache/2.0.54
//平臺apache 版本2.0.54
Server Hostname: 127.0.0.1
//服務器主機名
Server Port: 80
//服務器端口
Document Path: /index.html.zh-cn.gb2312
//測試的頁面文檔
Document Length: 1018 bytes
//文檔大小
Concurrency Level: 1000
//并發數
Time taken for tests: 8.188731 seconds
//整個測試持續的時間
Complete requests: 1000
//完成的哀求數量
Failed requests: 0
//失敗的哀求數量
Write errors: 0
Total transferred: 1361581 bytes
//整個場景中的網絡傳輸量
HTML transferred: 1055666 bytes
//整個場景中的HTML內容傳輸量
Requests per second: 122.12 [#/sec] (mean)
//大家最關心的指標之一,相當于 LR 中的 每秒事務數 ,后面括號中的 mean 表示這是一個平均值
Time per request: 8188.731 [ms] (mean)
//大家最關心的指標之二,相當于 LR 中的 平均事務響應時間 ,后面括號中的 mean 表示這是一個平均值
Time per request: 8.189 [ms] (mean, across all concurrent requests)
//每個哀求實際運行時間的平均值
Transfer rate: 162.30 [Kbytes/sec] received
//平均每秒網絡上的流量,可以幫助排除是否存在網絡流量過大導致響應時間延長的問題
Connection Times (ms)
min mean[+/-sd] median max
Connect: 4 646 1078.7 89 3291
Processing: 165 992 493.1 938 4712
Waiting: 118 934 480.6 882 4554
Total: 813 1638 1338.9 1093 7785
//網絡上消耗的時間的分解,各項數據的具體算法還不是很清楚
Percentage of the requests served within a certain time (ms)
50% 1093
66% 1247
75% 1373
80% 1493
90% 4061
95% 4398
98% 5608
99% 7368
100% 7785 (longest request)
//整個場景中所有哀求的響應情況.在場景中每個哀求都有一個響應時間,其中50%的用戶響應時間小于1093 毫秒,60% 的用戶響應時間小于1247 毫秒,最大的響應時間小于7785 毫秒
由于對于并發哀求,cpu實際上并不是同時處理的,而是按照每個哀求獲得的時間片逐個輪轉處理的,所以基本上第一個Time per request時間約等于第二個Time per request時間乘以并發哀求數.
《如何使用Apache的ab進行壓力測試》是否對您有啟發,歡迎查看更多與《如何使用Apache的ab進行壓力測試》相關教程,學精學透。維易PHP學院為您提供精彩教程。